Extract residual correlations based on latent factors
Source:R/residual_cor.R
residual_cor.jsdgam.RdCompute residual correlation estimates from Joint Species Distribution
(jsdgam) or mvgam models that either used latent factors
or included correlated process errors directly
Arguments
- object
listobject of classmvgamresulting from a call tojsdgam()or a call tomvgam()in which eitheruse_lv = TRUEor a multivariate process was used withcor = TRUE(seeRW()andVAR()for examples)- ...
ignored
- summary
Should summary statistics be returned instead of the raw values? Default is
TRUE..- robust
If
FALSE(the default) the mean is used as a measure of central tendency. IfTRUE, the median is used instead. Only used ifsummaryisTRUE- probs
The percentiles to be computed by the
quantilefunction. Only used ifsummaryisTRUE.
Value
If summary = TRUE, a list of
mvgam_residcor-class with the following components:
- cor, cor_lower, cor_upper
A set of \(p \times p\) correlation matrices, containing either the posterior median or mean estimate, plus lower and upper limits of the corresponding credible intervals supplied to
probs- sig_cor
A \(p \times p\) correlation matrix containing only correlations whose credible interval does not contain zero. All other correlations are set to zero
- prec, prec_lower, prec_upper
A set of \(p \times p\) precision matrices, containing either the posterior median or mean estimate, plus lower and upper limits of the corresponding credible intervals supplied to
probs- sig_prec
A \(p \times p\) precision matrix containing only precisions whose credible interval does not contain zero. All other precisions are set to zero
- cov
A \(p \times p\) posterior median or mean covariance matrix
- trace
The median/mean point estimator of the trace (sum of the diagonal elements) of the residual covariance matrix
cov
If summary = FALSE, this function returns a list containing the
following components:
- all_cormat
A \(n_{draws} \times p \times p\)
arrayof posterior residual correlation matrix draws- all_covmat
A \(n_{draws} \times p \times p\)
arrayof posterior residual covariance matrix draws- all_presmat
A \(n_{draws} \times p \times p\)
arrayof posterior residual precision matrix draws- all_trace
A \(n_{draws}\)
vectorof posterior covariance trace draws
Details
See mvgam_residcor-class for a description of the quantities
that are computed and returned by this function, along with key references.
References
Hui, F. K. C. (2016). boral – Bayesian Ordination and Regression Analysis of Multivariate Abundance Data in r. Methods in Ecology and Evolution, 7(6), 744-750. doi:10.1111/2041-210X.12514
Examples
# \dontrun{
# Fit a JSDGAM to the portal_data captures
mod <- jsdgam(
formula = captures ~
# Fixed effects of NDVI and mintemp, row effect as a GP of time
ndvi_ma12:series + mintemp:series + gp(time, k = 15),
factor_formula = ~ -1,
data = portal_data,
unit = time,
species = series,
family = poisson(),
n_lv = 2,
silent = 2,
chains = 2
)
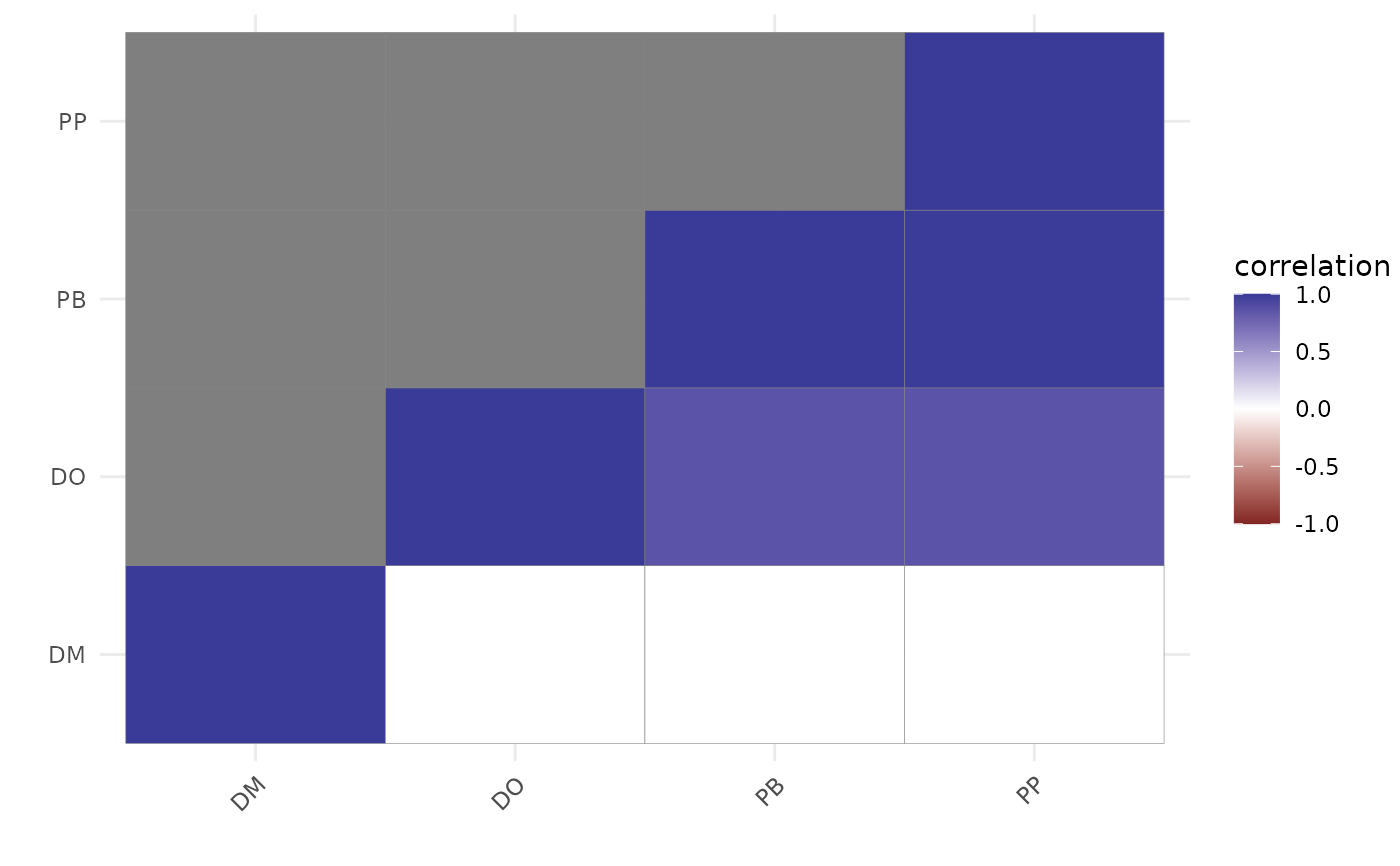
# Plot residual correlations
plot(
residual_cor(mod)
)
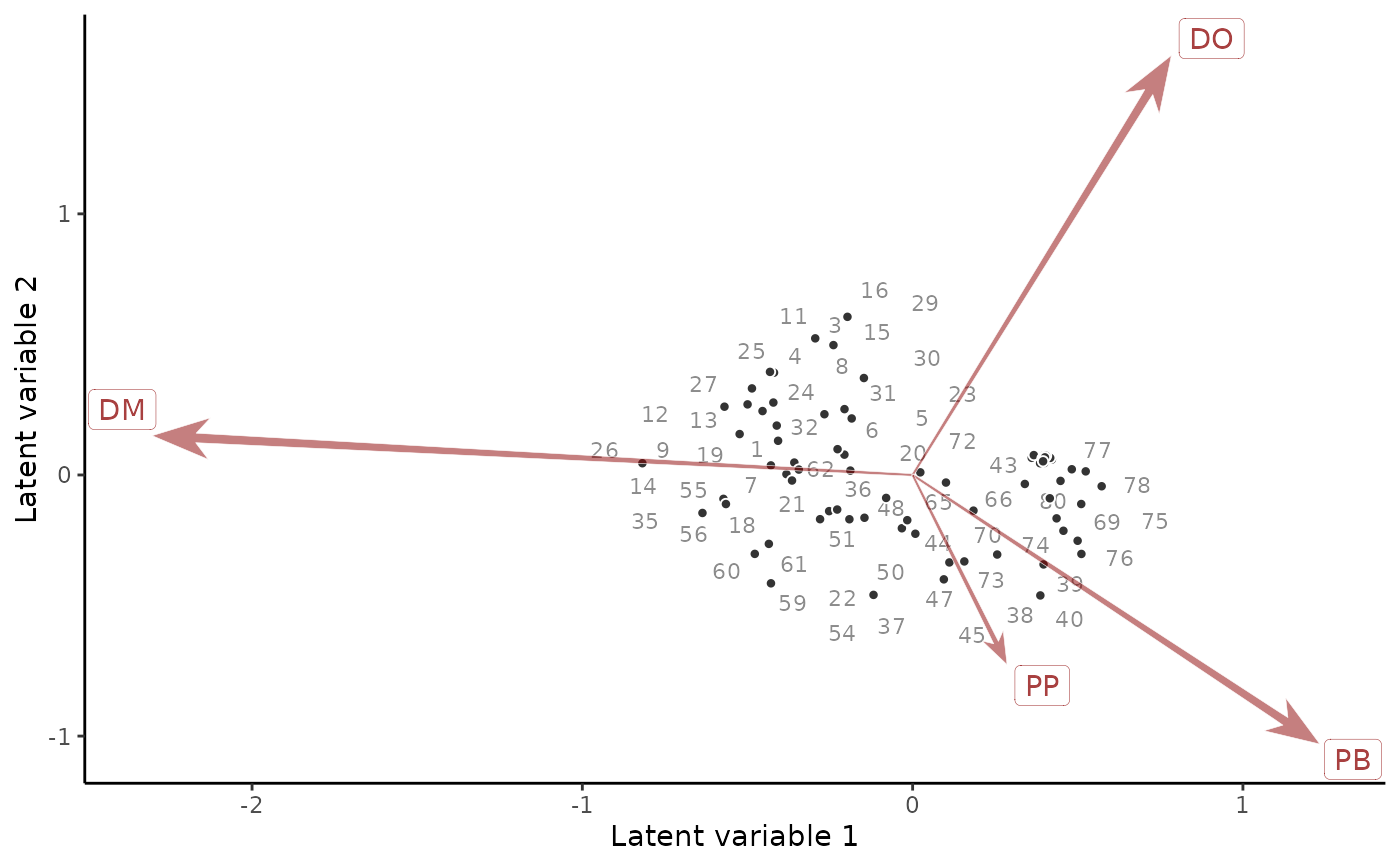
 # Compare to a residual ordination biplot
if(requireNamespace('ggrepel', quietly = TRUE)){
ordinate(mod)
}
#> Warning: ggrepel: 19 unlabeled data points (too many overlaps). Consider increasing max.overlaps
# Compare to a residual ordination biplot
if(requireNamespace('ggrepel', quietly = TRUE)){
ordinate(mod)
}
#> Warning: ggrepel: 19 unlabeled data points (too many overlaps). Consider increasing max.overlaps
 # Not needed for general use; cleans up connections for automated testing
closeAllConnections()
# }
# Not needed for general use; cleans up connections for automated testing
closeAllConnections()
# }