Perform unconditional posterior predictive checks with the help of the bayesplot package.
Usage
# S3 method for mvgam
pp_check(
  object,
  type,
  ndraws = NULL,
  prefix = c("ppc", "ppd"),
  group = NULL,
  x = NULL,
  newdata = NULL,
  ...
)
Arguments
- object
An object of class
mvgam- type
Type of the ppc plot as given by a character string. See
PPCfor an overview of currently supported types. You may also use an invalid type (e.g.type = "xyz") to get a list of supported types in the resulting error message.- ndraws
Positive integer indicating how many posterior draws should be used. If
NULLall draws are used. If not specified, the number of posterior draws is chosen automatically. Ignored ifdraw_idsis notNULL.- prefix
The prefix of the bayesplot function to be applied. Either `"ppc"` (posterior predictive check; the default) or `"ppd"` (posterior predictive distribution), the latter being the same as the former except that the observed data is not shown for `"ppd"`.
- group
Optional name of a factor variable in the model by which to stratify the ppc plot. This argument is required for ppc
*_groupedtypes and ignored otherwise.- x
Optional name of a variable in the model. Only used for ppc types having an
xargument and ignored otherwise.- newdata
Optional
dataframeorlistof test data containing the variables included in the linear predictor offormula. If not supplied, predictions are generated for the original observations used for the model fit. Ignored if using one of the residual plots (i.e. 'resid_hist')- ...
Further arguments passed to
predict.mvgamas well as to the PPC function specified intype
Details
Unlike the conditional posterior checks provided by ppc,
This function computes unconditional posterior predictive checks (i.e. it generates
predictions for fake data without considering the true observations associated with those
fake data). For a detailed explanation of each of the ppc functions,
see the PPC
documentation of the bayesplot
package.
Examples
# \dontrun{
simdat <- sim_mvgam(seasonality = "hierarchical")
mod <- mvgam(
y ~ series +
s(season, bs = "cc", k = 6) +
s(season, series, bs = "fs", k = 4),
data = simdat$data_train,
chains = 2,
silent = 2
)
#> Warning: model has repeated 1-d smooths of same variable.
#> Warning: model has repeated 1-d smooths of same variable.
#> Warning: model has repeated 1-d smooths of same variable.
# Use pp_check(mod, type = "xyz") for a list of available plot types
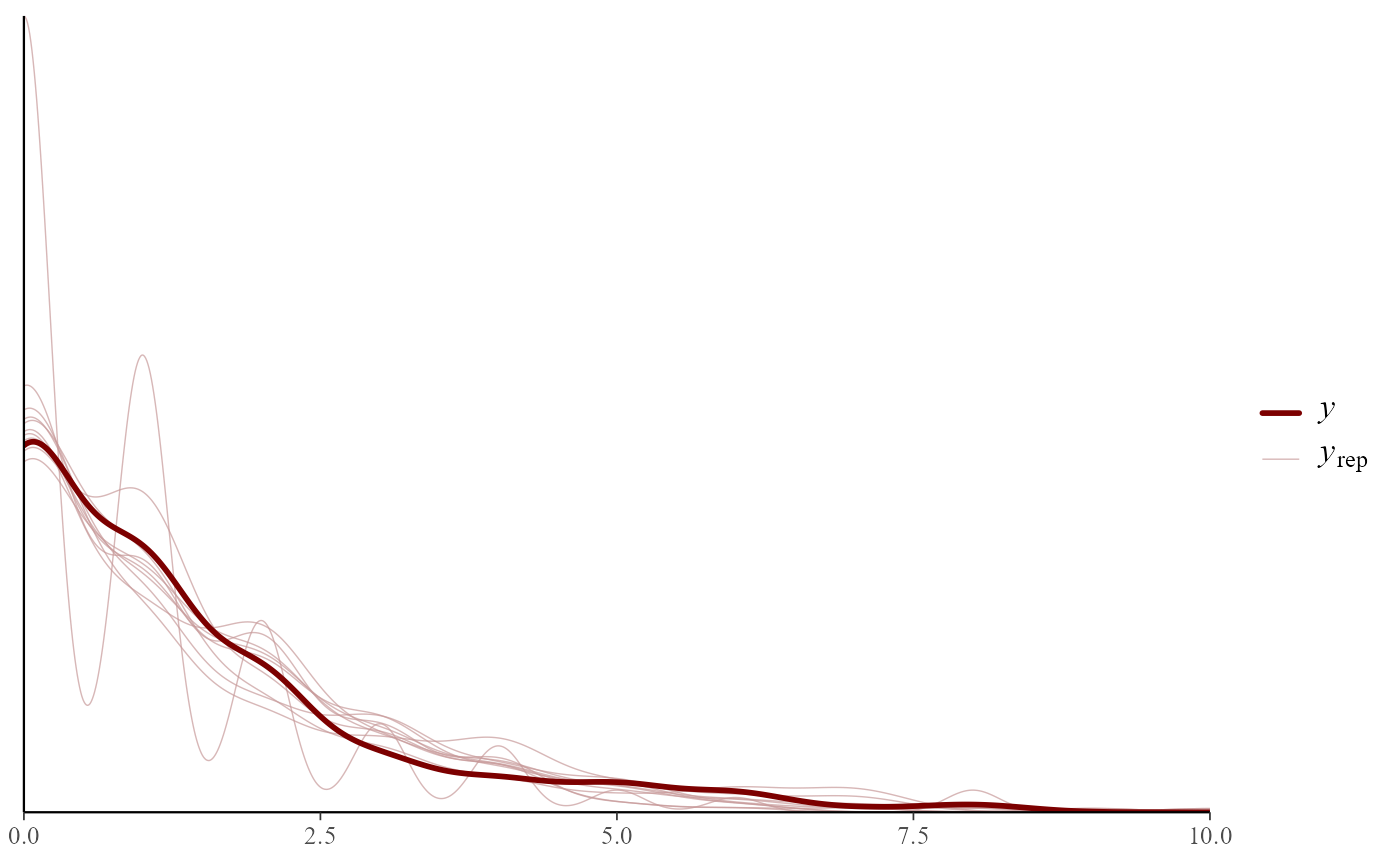
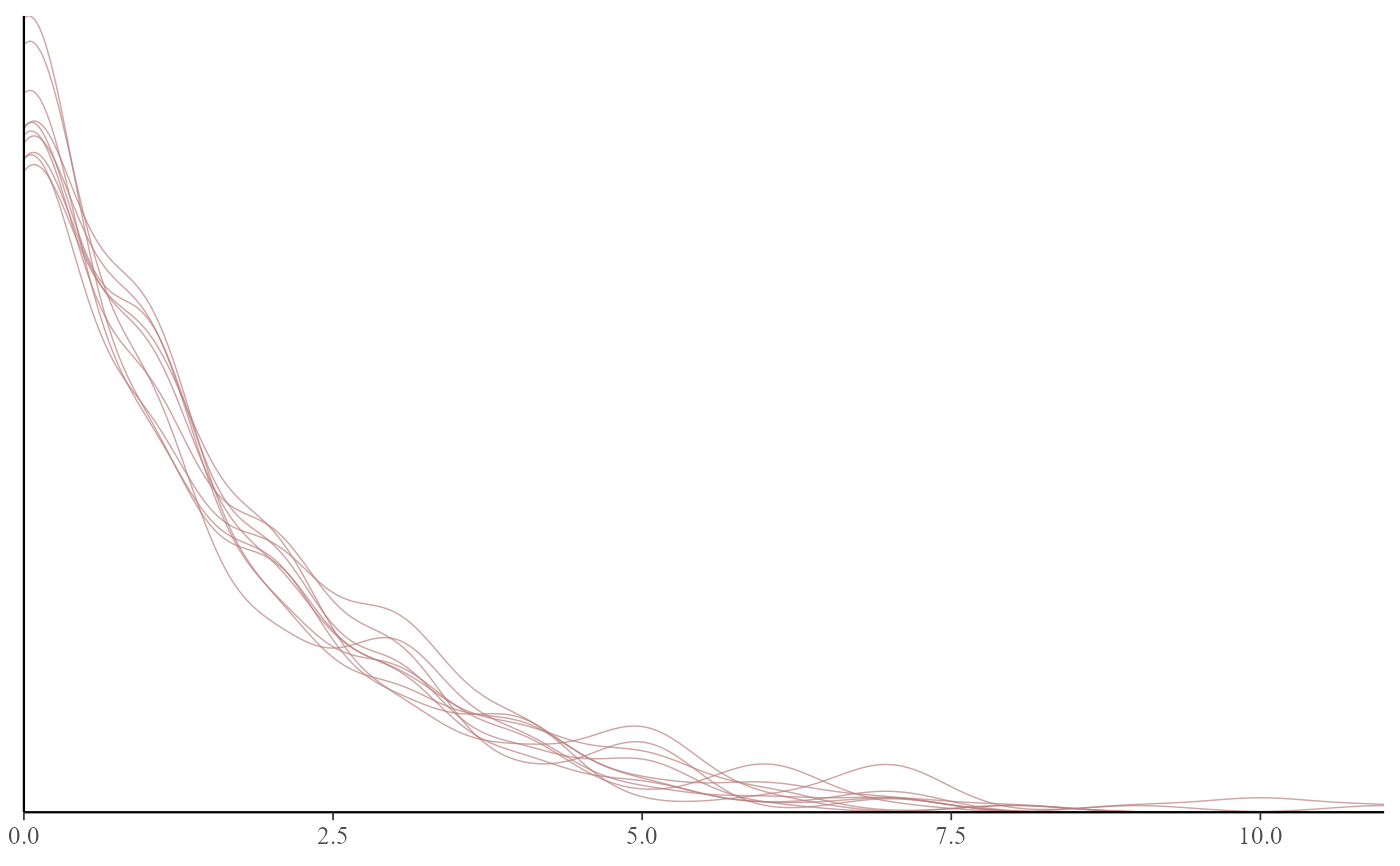
# Default is a density overlay for all observations
pp_check(mod)
#> Using 10 posterior draws for ppc type 'dens_overlay' by default.
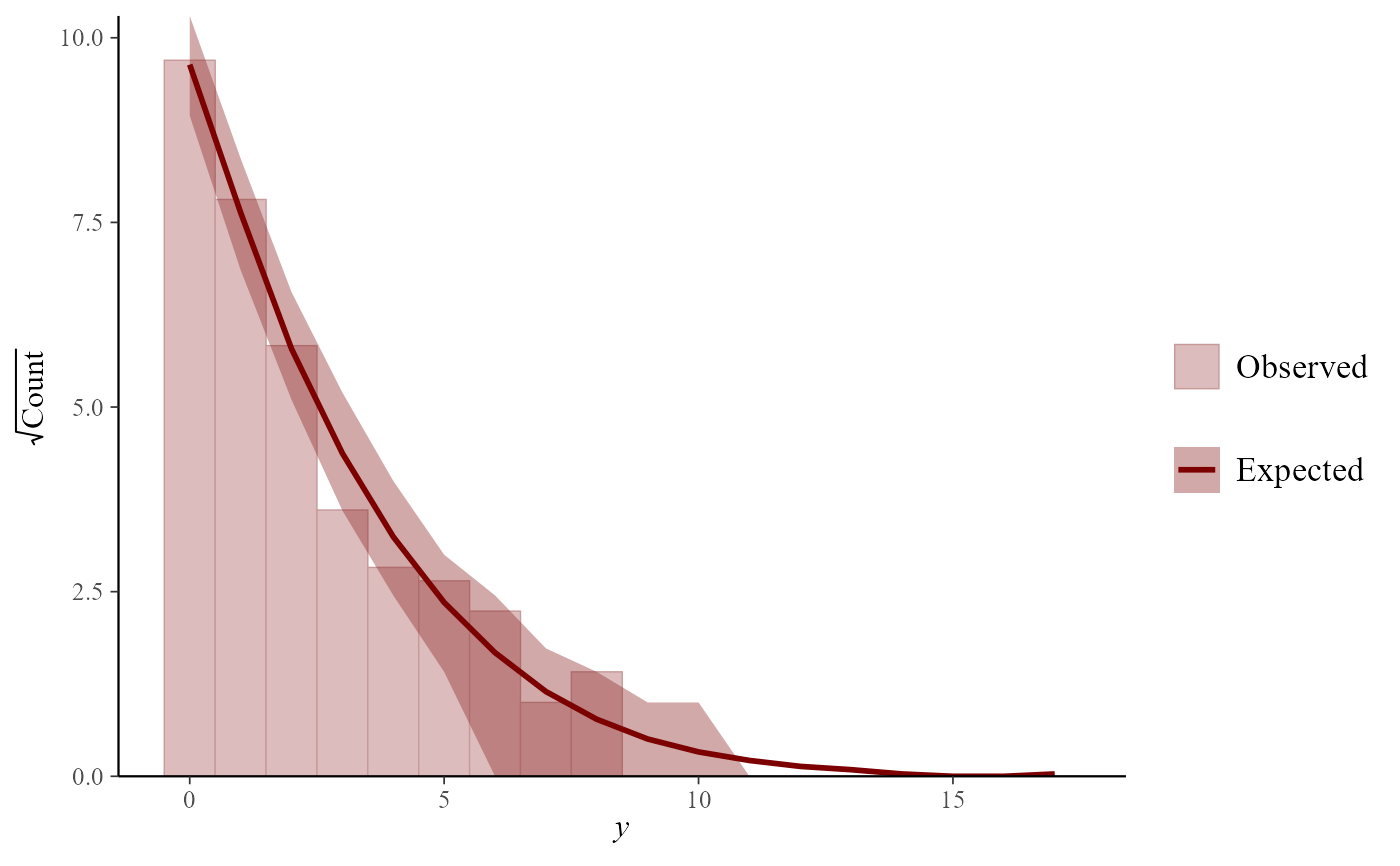
 # Rootograms particularly useful for count data
pp_check(mod, type = "rootogram")
#> Using all posterior draws for ppc type 'rootogram' by default.
# Rootograms particularly useful for count data
pp_check(mod, type = "rootogram")
#> Using all posterior draws for ppc type 'rootogram' by default.
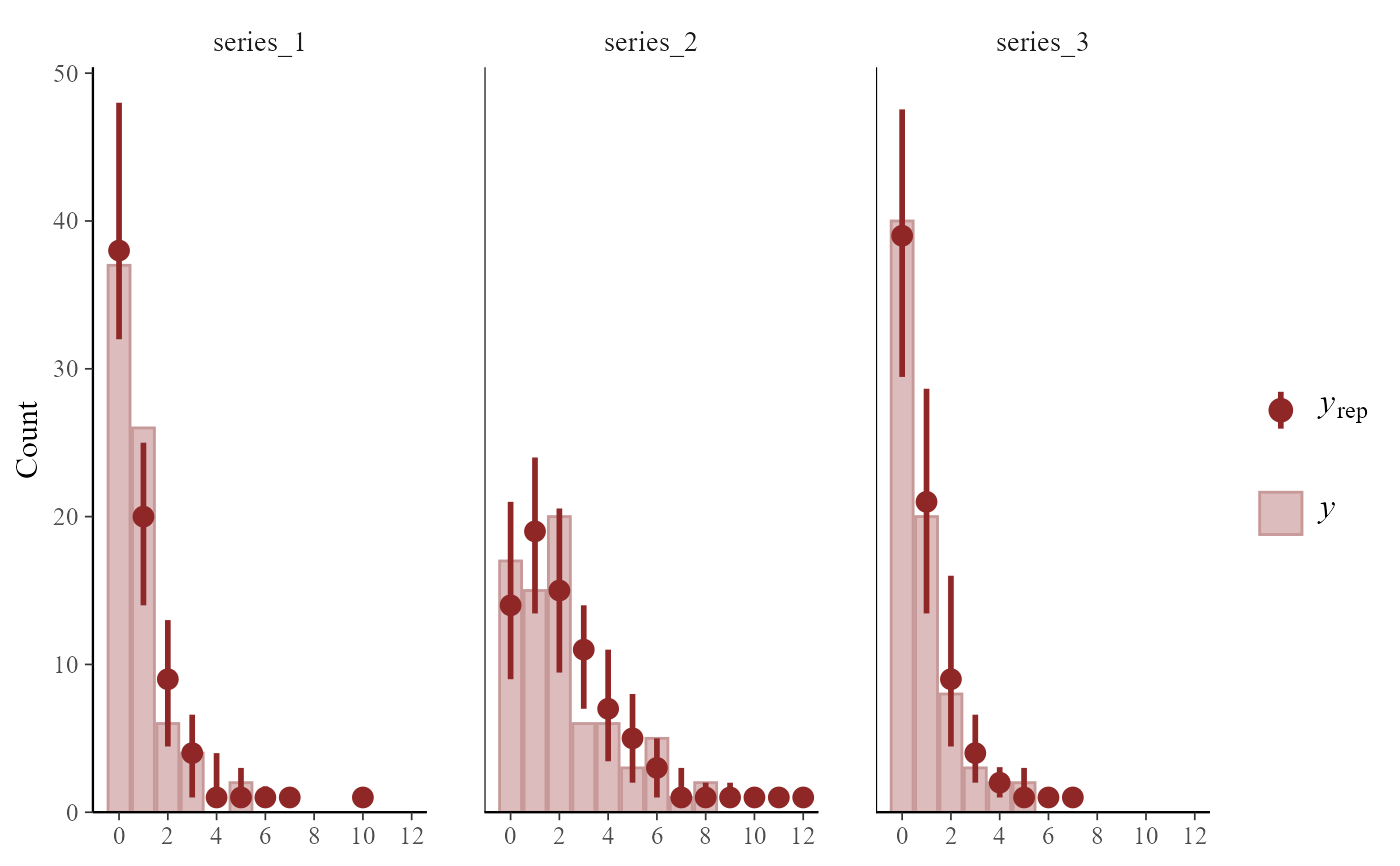
 # Grouping plots by series is useful
pp_check(mod,
type = "bars_grouped",
group = "series", ndraws = 50
)
# Grouping plots by series is useful
pp_check(mod,
type = "bars_grouped",
group = "series", ndraws = 50
)
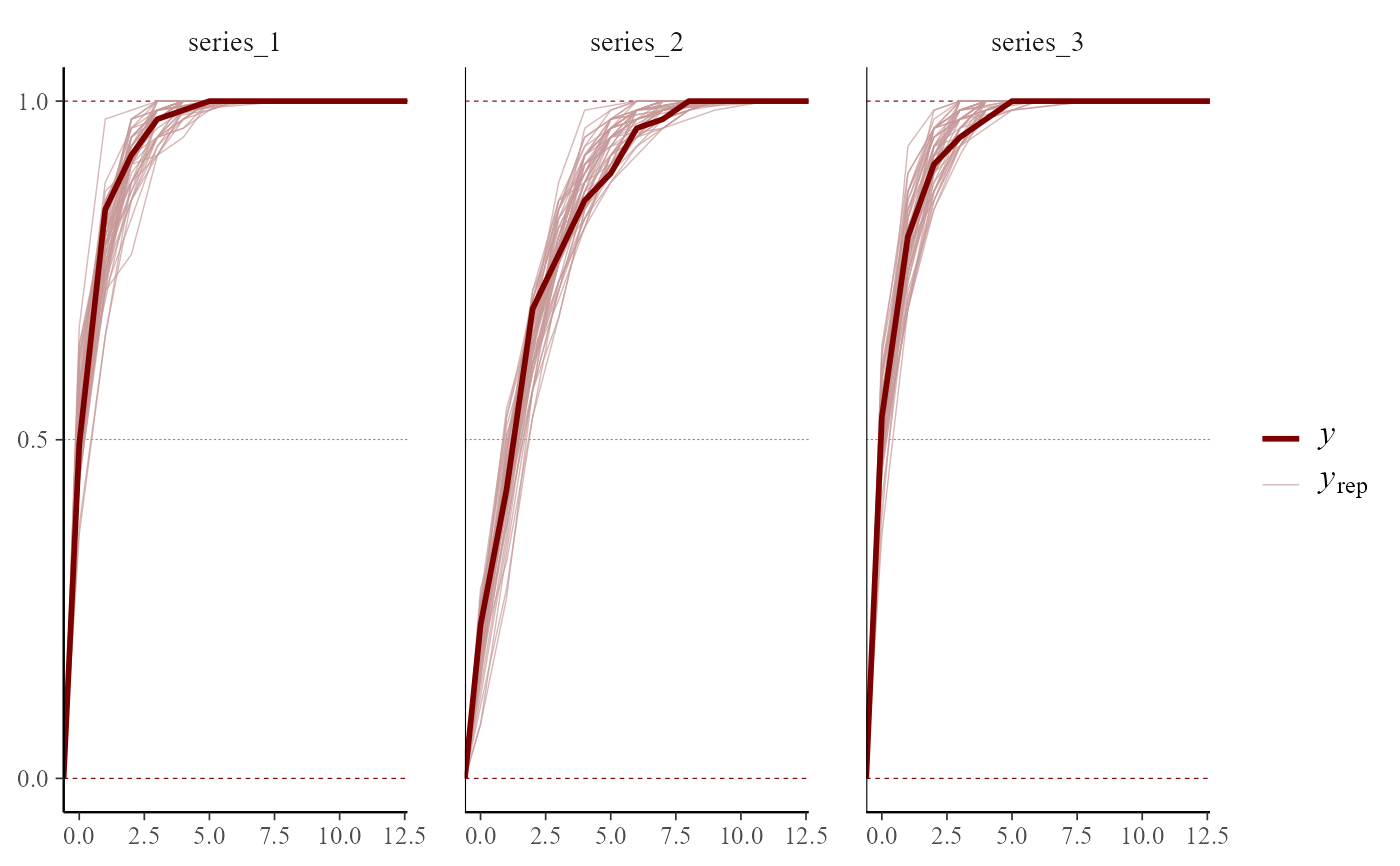
 pp_check(mod,
type = "ecdf_overlay_grouped",
group = "series", ndraws = 50
)
pp_check(mod,
type = "ecdf_overlay_grouped",
group = "series", ndraws = 50
)
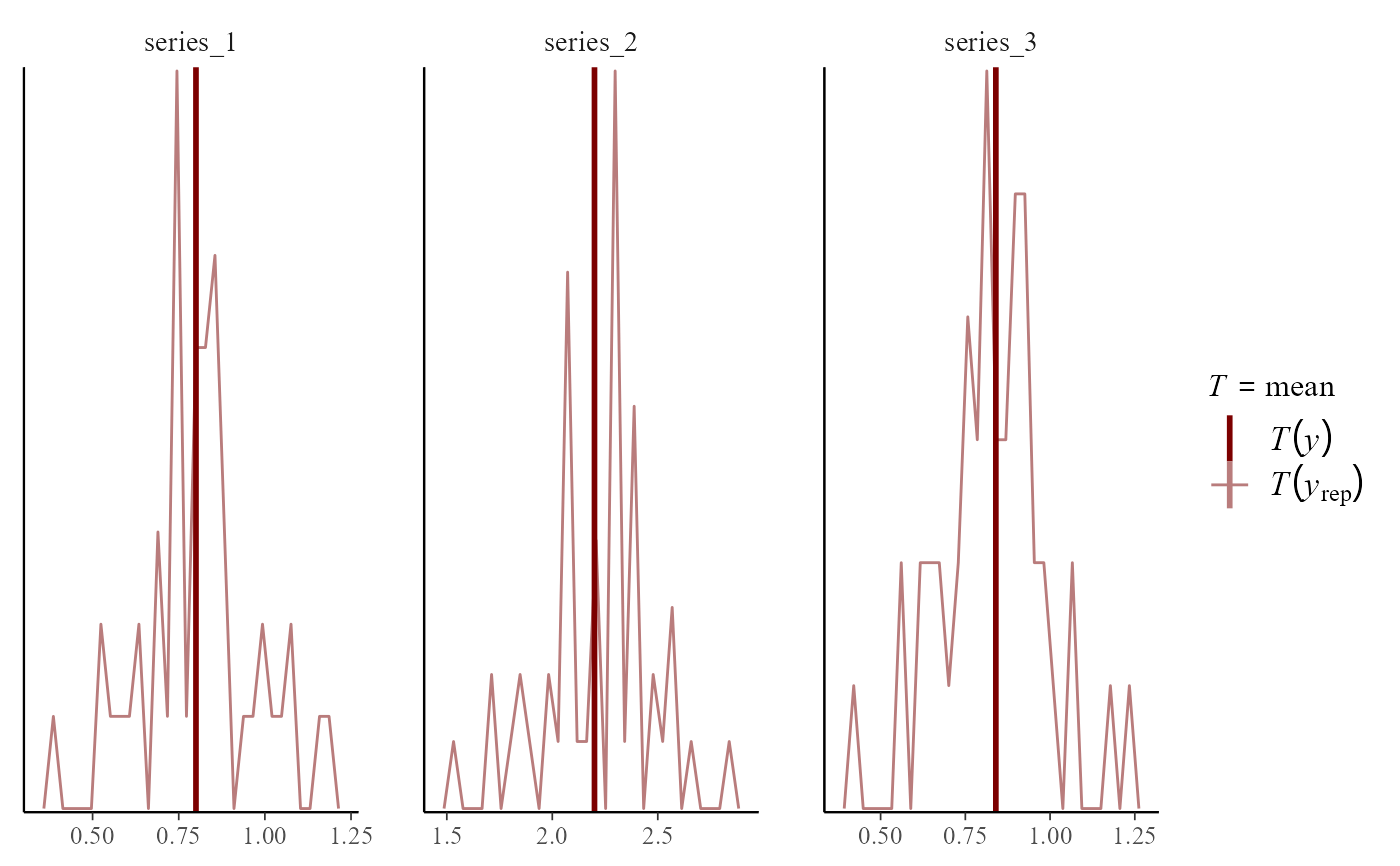
 pp_check(mod,
type = "stat_freqpoly_grouped",
group = "series", ndraws = 50
)
#> Note: in most cases the default test statistic 'mean' is too weak to detect anything of interest.
#> `stat_bin()` using `bins = 30`. Pick better value `binwidth`.
pp_check(mod,
type = "stat_freqpoly_grouped",
group = "series", ndraws = 50
)
#> Note: in most cases the default test statistic 'mean' is too weak to detect anything of interest.
#> `stat_bin()` using `bins = 30`. Pick better value `binwidth`.
 # Several types can be used to plot distributions of randomized
# quantile residuals
pp_check(
object = mod,
x = "season",
type = "resid_ribbon"
)
#> Using 10 posterior draws for ppc type 'resid_ribbon' by default.
# Several types can be used to plot distributions of randomized
# quantile residuals
pp_check(
object = mod,
x = "season",
type = "resid_ribbon"
)
#> Using 10 posterior draws for ppc type 'resid_ribbon' by default.
 pp_check(
object = mod,
x = "season",
group = "series",
type = "resid_ribbon_grouped"
)
#> Using 10 posterior draws for ppc type 'resid_ribbon_grouped' by default.
pp_check(
object = mod,
x = "season",
group = "series",
type = "resid_ribbon_grouped"
)
#> Using 10 posterior draws for ppc type 'resid_ribbon_grouped' by default.
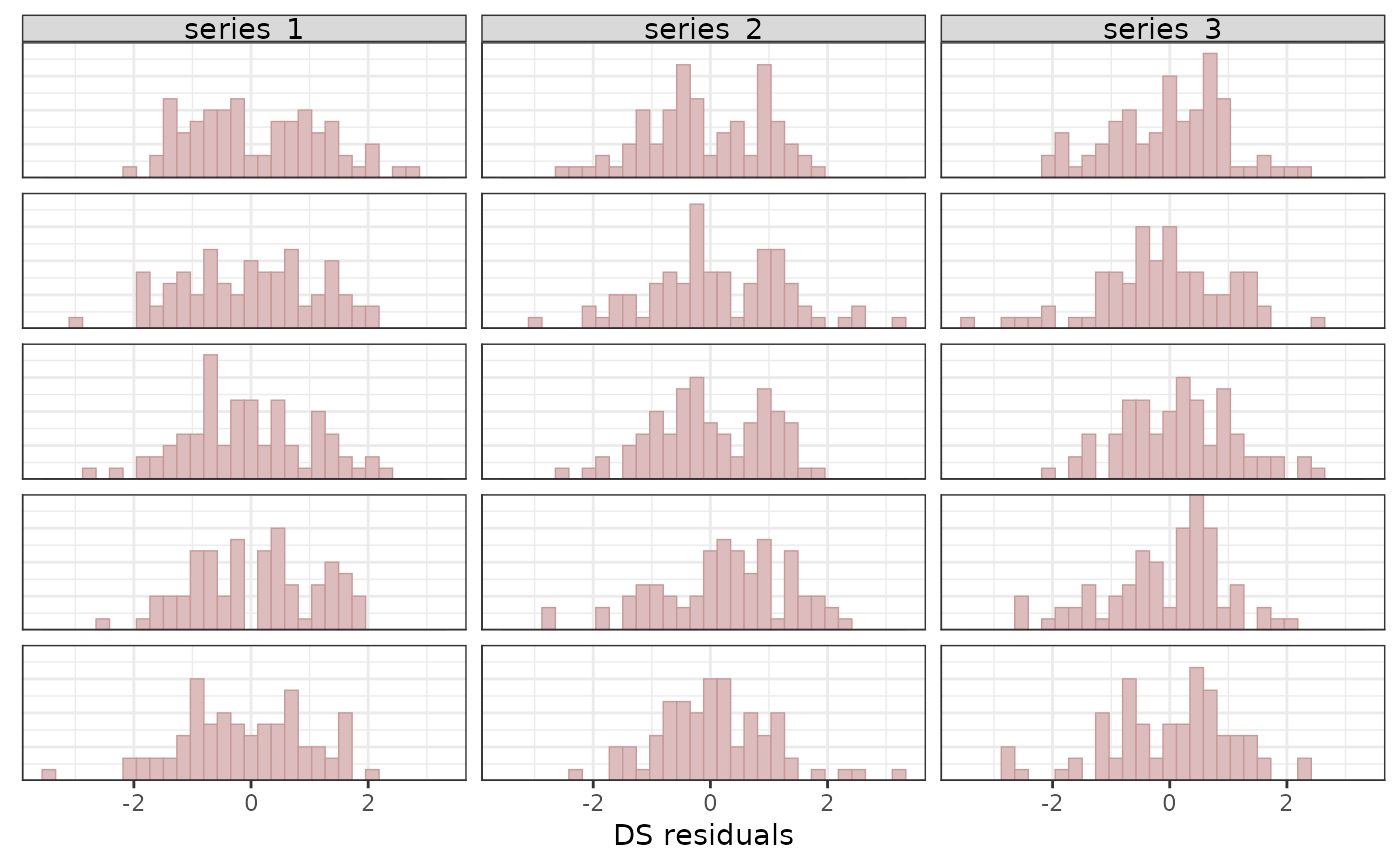
 pp_check(mod,
ndraws = 5,
type = "resid_hist_grouped",
group = "series"
)
#> `stat_bin()` using `bins = 30`. Pick better value `binwidth`.
pp_check(mod,
ndraws = 5,
type = "resid_hist_grouped",
group = "series"
)
#> `stat_bin()` using `bins = 30`. Pick better value `binwidth`.
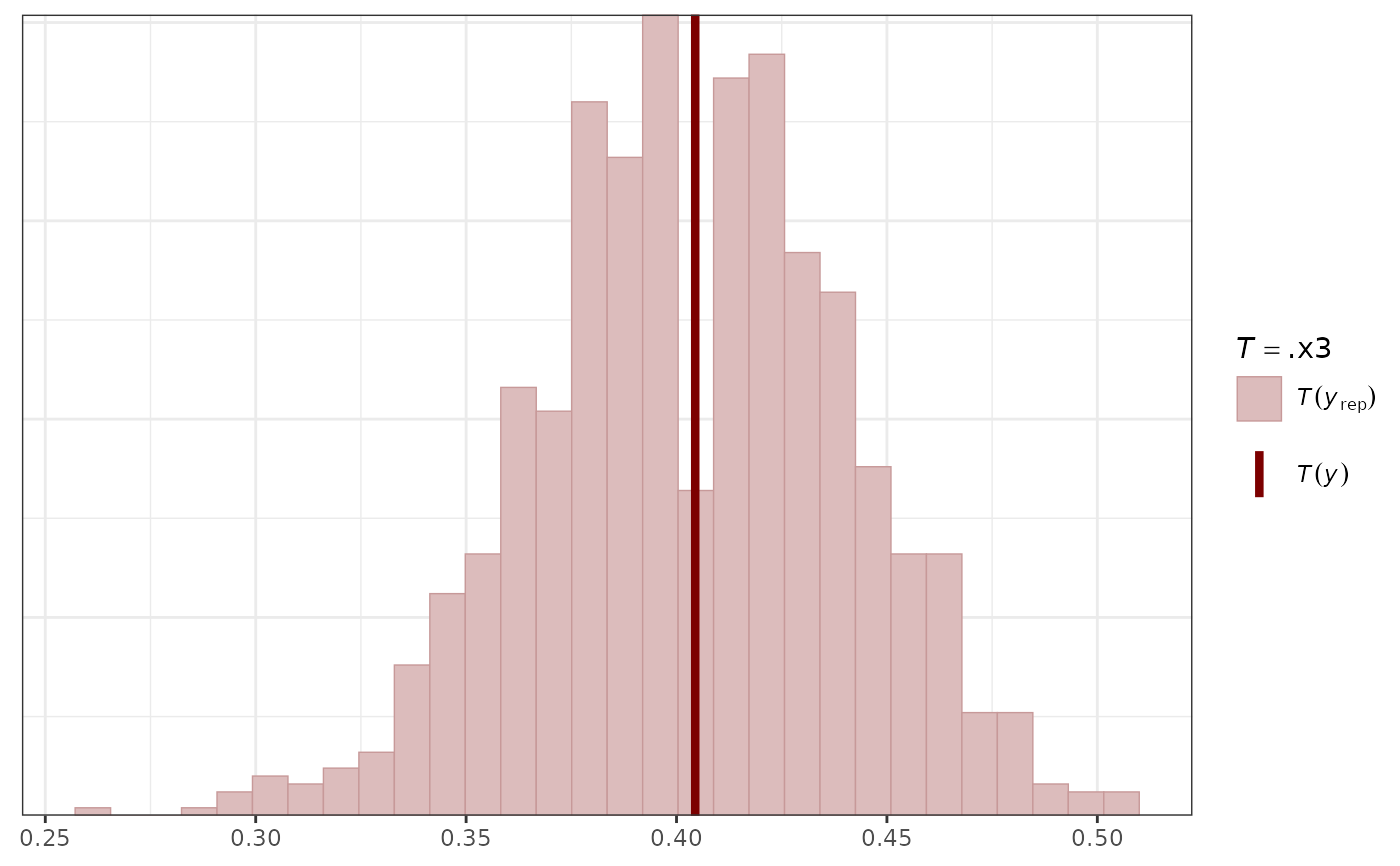
 # Custom functions accepted
pp_check(mod, type = "stat", stat = function(x) mean(x == 0))
#> Using all posterior draws for ppc type 'stat' by default.
#> `stat_bin()` using `bins = 30`. Pick better value `binwidth`.
# Custom functions accepted
pp_check(mod, type = "stat", stat = function(x) mean(x == 0))
#> Using all posterior draws for ppc type 'stat' by default.
#> `stat_bin()` using `bins = 30`. Pick better value `binwidth`.
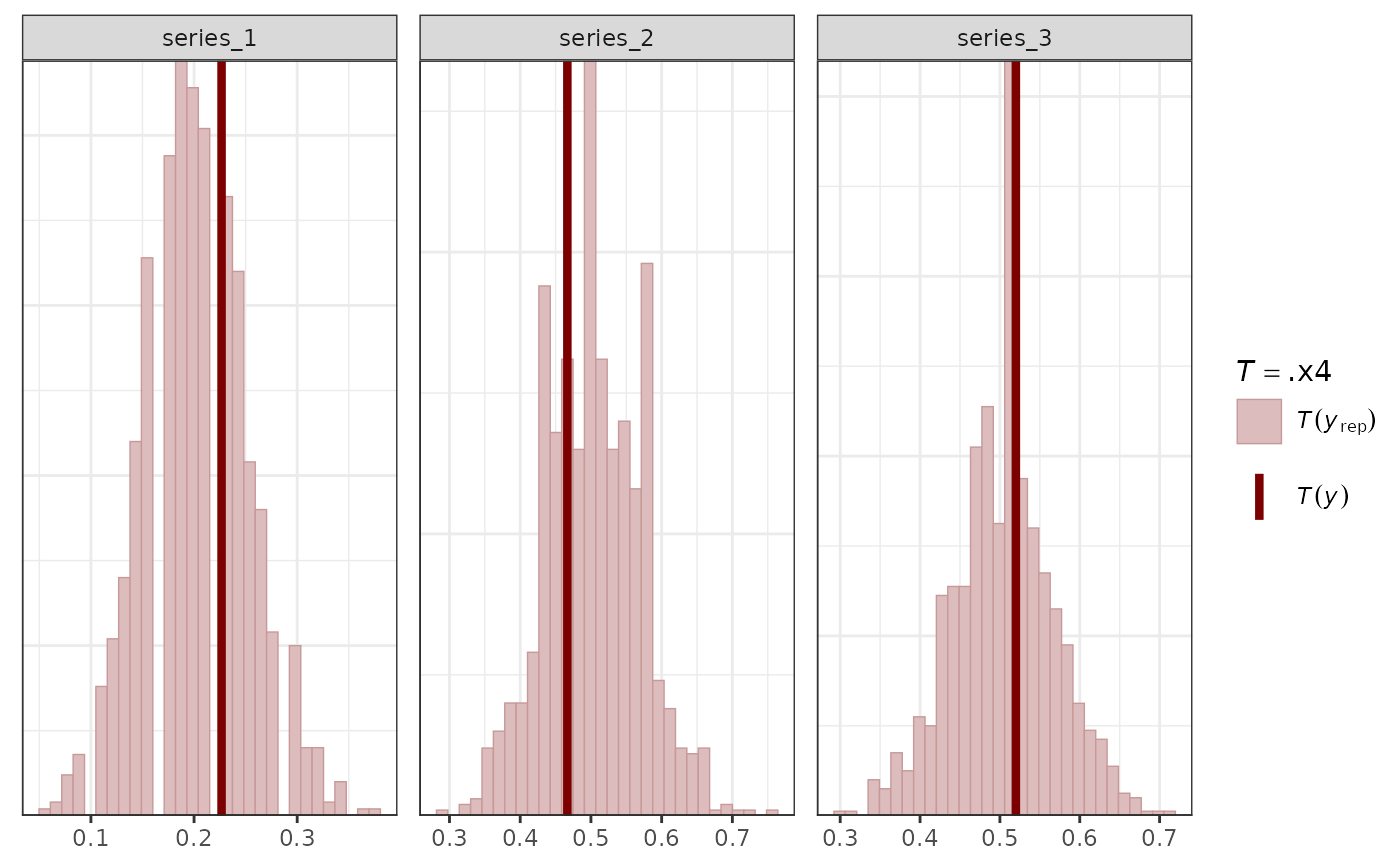
 pp_check(mod,
type = "stat_grouped",
stat = function(x) mean(x == 0),
group = "series"
)
#> Using all posterior draws for ppc type 'stat_grouped' by default.
#> `stat_bin()` using `bins = 30`. Pick better value `binwidth`.
pp_check(mod,
type = "stat_grouped",
stat = function(x) mean(x == 0),
group = "series"
)
#> Using all posterior draws for ppc type 'stat_grouped' by default.
#> `stat_bin()` using `bins = 30`. Pick better value `binwidth`.
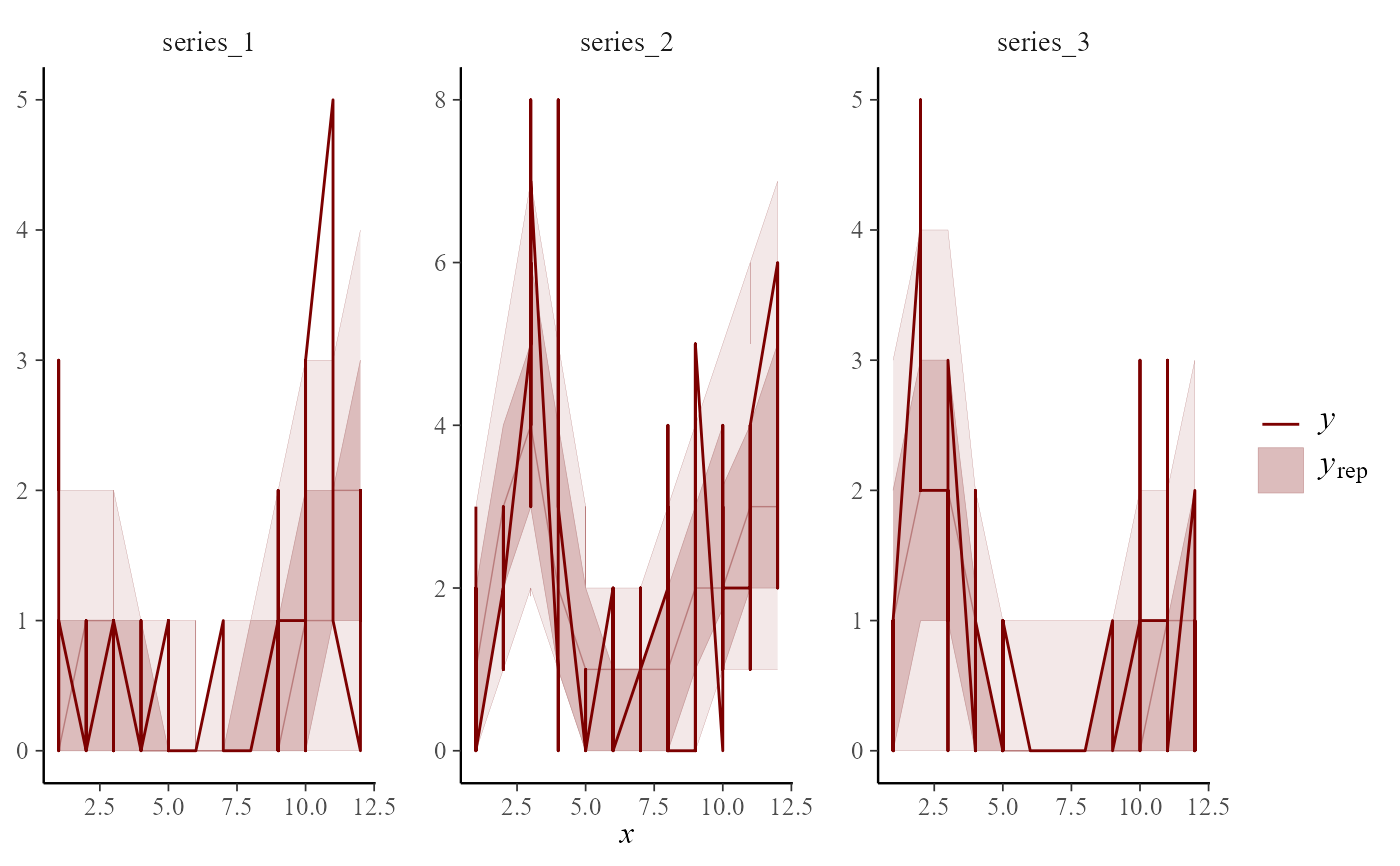
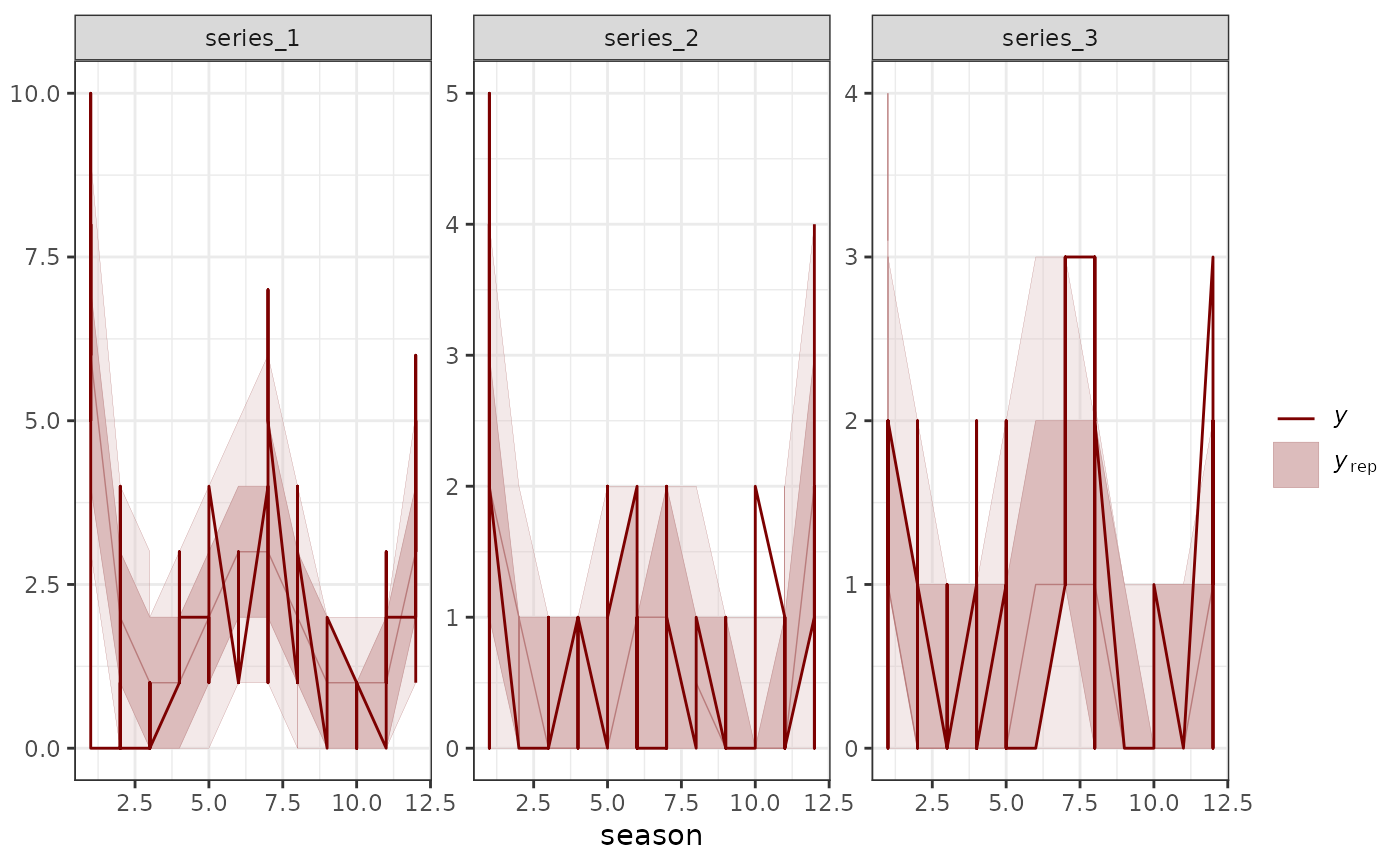
 # Some functions accept covariates to set the x-axes
pp_check(mod,
x = "season",
type = "ribbon_grouped",
prob = 0.5,
prob_outer = 0.8,
group = "series"
)
#> Using all posterior draws for ppc type 'ribbon_grouped' by default.
# Some functions accept covariates to set the x-axes
pp_check(mod,
x = "season",
type = "ribbon_grouped",
prob = 0.5,
prob_outer = 0.8,
group = "series"
)
#> Using all posterior draws for ppc type 'ribbon_grouped' by default.
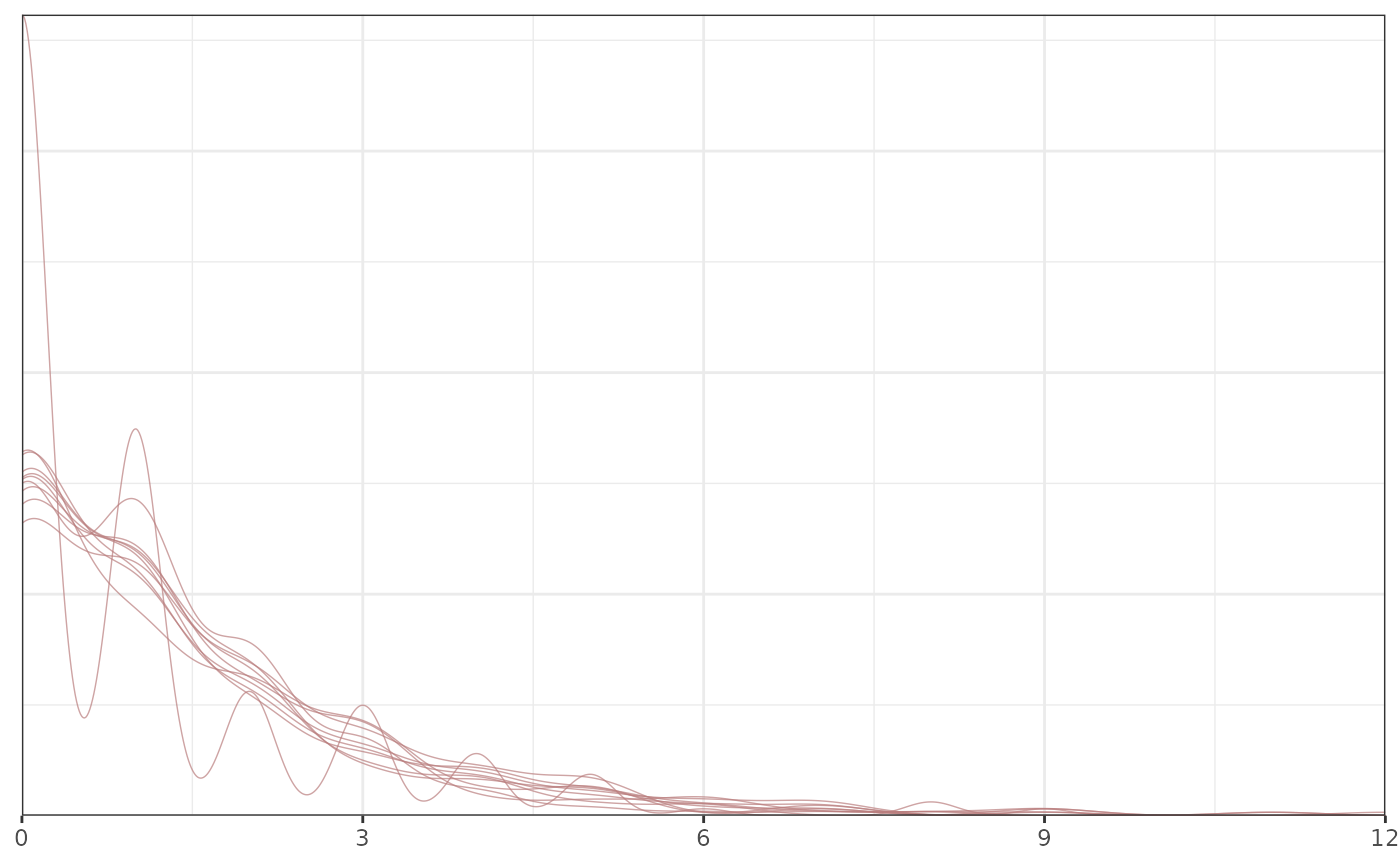
 # Many plots can be made without the observed data
pp_check(mod, prefix = "ppd")
#> Using 10 posterior draws for ppc type 'dens_overlay' by default.
# Many plots can be made without the observed data
pp_check(mod, prefix = "ppd")
#> Using 10 posterior draws for ppc type 'dens_overlay' by default.
 # }
# }